February 2026
🌧️ Mushers’ Lotion
It’s probably the most boring news item this month, I’m talking about rain: greatest precipitation, regular frequency, continuous cloud cover; umbrella sales. So what’s mushers’ lotion, I hear you ask? A musher is an owner-driver, as opposed to a cabbie who rents his cab, and lotion is rain, said to increase business, thus helping to pay off the huge costs of buying a vehicle.
🇺🇸 Visits from our Colonial Cousins
Around the middle of the month, CabbieBlog received a spike in the number of ‘hits’ from across the Pond. According to my counter, on the 12th-13th, 4,060 people took an interest in my musings. They were almost certainly bots harvesting data, but this is unusual for America; usually, China is the culprit, taking it upon itself to do web data extraction.
🚘 Gone in 60 Seconds
My 19-year-old VW Golf has developed a fault that prevents me from locking the rear doors. Until my mechanic can fit me in, I’ve had to rely on security devices, which got me rummaging around my garage to find five old locks, some fitting my Mini that I owned in the early 70s – none fit. My purchase of a Tevlaphee steering wheel lock, which hopefully will keep thieves at bay.
🚓 Tom’s Trivia
If you haven’t had enough of the London cab trade here at CabbieBlog, Tom Hutley’s new YouTube video with Joe Dan Hirst gives 40 minutes of London cab facts.
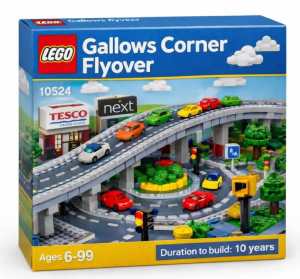
🏗️ Lego Gallows Corner
A farce has unfolded since 23 June last year, when this important junction was closed and scheduled to reopen in September. Without suitable detours, driving around Romford has been horrendous, with 40-tonne lorries negotiating country lanes. The work was then promised to last 6 months longer than scheduled; nobody is holding their breath. Now a wag has dreamt up this Lego set, replete with a speed camera and the guide to the duration of the build at 10 years.
📅 February’s posts and pages
Most read post – Mr Ormes’s Parrot
Most read page – Green Cab Shelters
📈 Last month’s statistics
2,649 views (-68.2%)
2,322 visitors (-69.0%)
26 likes (-16.1%)
54 comments (+86.2%)
15 posts (+15.4%)
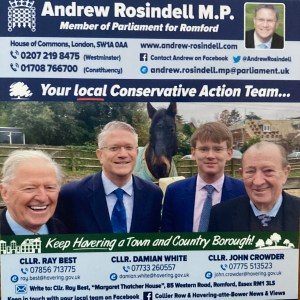
 Andrew is convinced that Romford shouldn’t be in Europe, be a part of London, or within the embrace of the political party he’s been a member of since he was 14. He has proposed that “Havering Belongs in Essex – Not Greater London”. Andrew loves to use the coat of arms of the long-defunct Municipal Borough of Romford, so it appears on his flyer. I suspect soon we’ll have Romford passports.
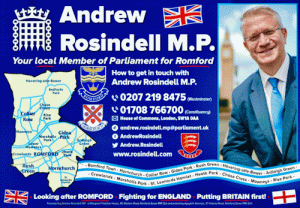